
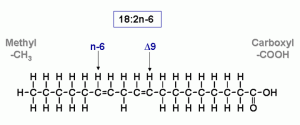
Anatomy of a fatty acid
Fatty acid analysis uses the components of dietary fat as an indicator of past diet. Animal fats (which are also called lipids) are primarily in the form of triacylglycerols: three fatty acid molecules attached to a glycerol backbone. Each fatty acid is made up of a long hydrocarbon chain that contains a variable number of double bonds. The physical characteristics of the fatty acid (e.g., length of the carbon chain, number of double bonds) determine its biochemical properties (e.g., solubility, melting point) and each fatty acid is named according to its structure. For instance, the lower right figure illustrates the structure of linoleic acid, which is also referred to as 18:2n-6. This nomenclature reflects the fact that there are 18 carbons and 2 double bonds in the hydrocarbon chain. The first double bond is in the “n-6” position, which is the sixth carbon from the methyl end of the chain. In most fatty acids, double bonds are separated by a single methylene group (– CH2 –) so the position of all double bonds can be inferred from this shorthand nomenclature. For unusual non-methylene-interrupted fatty acids (see below) the positions of each double bond must be given. These positions are usually expressed relative to the carboxyl end of the molecule (e.g., 22:2∆7,15 has double bonds at the ∆7 and ∆15 positions).
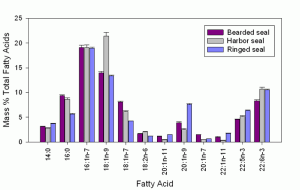
Fatty acid signatures. Credit: Thiemann et al. 2008
Researchers can often identify more than 70 different fatty acids in the fat stores of marine organisms like polar bears. Most of these compounds will be present in all of the available foods so we may not be able to determine where any individual fatty acid originated in the diet. However, prey species usually differ in their relative proportions of various fatty acids. This overall profile across several fatty acids is termed a fatty acid signature.
Because fatty acid stores are strongly influenced by diet, differences in fatty acid signatures among polar bears reflect differences in foraging habits. A variety of multivariate statistical tools can be used to determine if groups of bears (e.g., age or sex classes) have different fatty acid signatures. In addition, Iverson et al. (2004) developed a multivariate statistical model that quantitatively estimates the diet composition of individual predators. The model works by identifying the proportional combination of different prey types that comes closest to matching the observed predator signature.
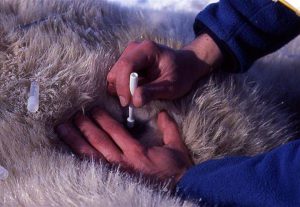
Getting fatty acid samples from a polar bear. Credit: Dennis Andriashek
The fatty acid profile of an individual polar bear can be readily determined from a small tissue biopsy taken through the skin of an immobilized bear. This technique has been used to generate quantitative estimates of polar bear diets across the Canadian Arctic (Iverson et al. 2006, Thiemann et al. 2008, Galicia et al. 2015).
The QFASA approach models the fatty acid signature of a predator as a combination of the signatures of its potential prey. Diet is thus estimated as the proportional combination of prey that minimizes the distance between the modelled and observed predator signatures, after applying calibration coefficients. Multiple refinements have been made to the QFASA approach in recent years that allow researchers to improve the accuracy and precision of QFASA-derived estimates (e.g., Bromaghin et al. 2015, 2016, 2017). The package qfasar allows users to run QFASA, and multiple diagnostics, in the R software environment.